
In today’s dynamic IT landscape, effective monitoring of application servers (app servers) is crucial to ensure optimal performance, security, and user satisfaction. Monitoring tools help in identifying potential issues before they become critical, allowing for proactive management and maintenance. This blog will explore essential tools and techniques for app server monitoring, with a particular focus on web server monitoring, the differences between app servers and web servers, and the role of Apache Tomcat in app server environments.
Understanding App Servers and Web Servers
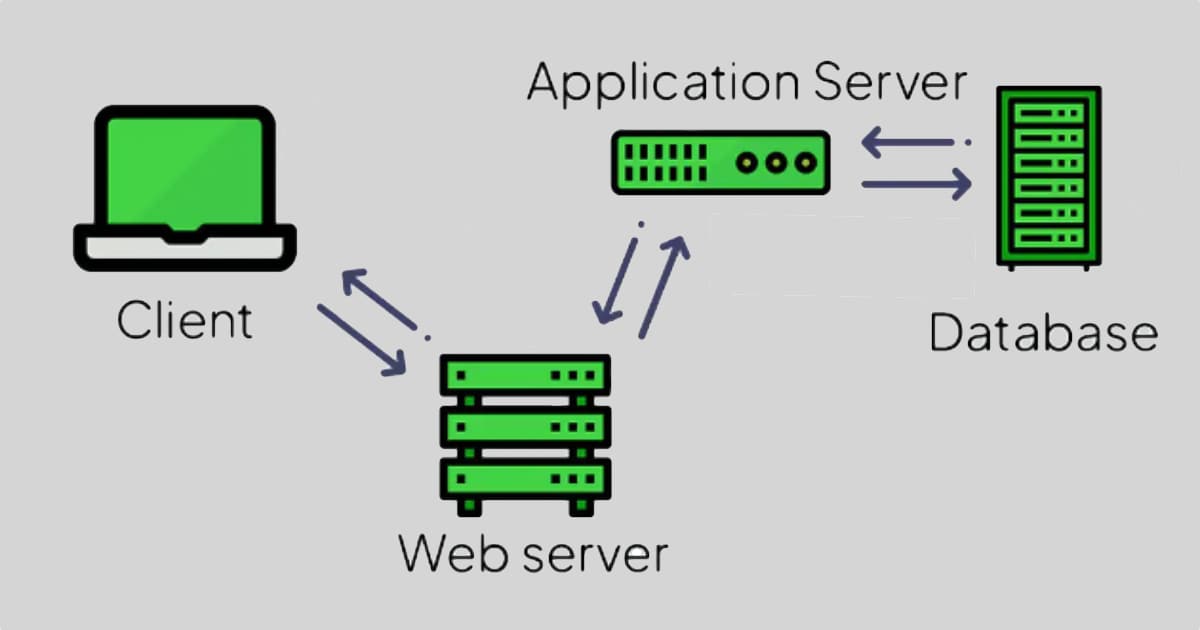
Before diving into monitoring tools and techniques, it’s important to distinguish between app servers and web servers.
App Server vs. Web Server
Web Servers:
- Web servers, such as Apache HTTP Server, handle HTTP requests and serve static content (HTML, CSS, JavaScript, images) to clients.
- They are optimized for managing and delivering web pages.
- Web server monitoring involves tracking metrics like request/response times, traffic volume, error rates, and server uptime.
App Servers:
- Application servers, such as Apache Tomcat, JBoss, and IBM WebSphere, run business logic for web applications.
- They support Java EE (Enterprise Edition) features such as transactions, messaging, and security.
- App server monitoring involves tracking application performance, connections, resource utilization (CPU, memory), and transaction processing times.
Why App Server Monitoring is Crucial
Effective app server monitoring ensures that applications run smoothly, meet performance expectations, and provide a good user experience. Monitoring helps in:
- Identifying and resolving performance bottlenecks.
- Ensuring high availability and reliability.
- Maintaining security and compliance.
- Optimizing resource utilization to reduce costs.
Essential App Server Monitoring Tools and Techniques
1. meshIQ for App Server Monitoring
meshIQ is a comprehensive platform designed for monitoring application servers. It offers advanced features for real-time monitoring, performance optimization, and automated troubleshooting. Delivering a single pane of glass for middleware technologies including App Servers.
Usage:
- Observability: meshIQ provides a single pane of glass for monitoring all your app servers, whether on-premise or in the cloud. This centralized approach simplifies management and improves operational efficiency.
- Real-Time Alerts and Analytics: Set up real-time alerts for critical issues such as high CPU usage, memory leaks, or transaction failures. meshIQ’s advanced analytics capabilities help you understand the root cause of problems and take proactive measures to prevent them.
- Management and Self-Service: Managing thousands of servers and the ability to give granular role-based access to different teams as they can create and manage their own configurations, saves time and makes efficient use of resources.
Industry Applications:
- Financial Services: Ensure compliance and optimal performance in transaction-heavy environments.
- Retail: Manage high transaction volumes efficiently to prevent bottlenecks in e-commerce platforms.
- Health Insurance: Maintain compliance with regulations like HIPAA while optimizing performance.
- P&C Insurance: Seamlessly integrate and manage legacy and modern systems for accurate and fast data processing.
2. Build your own (Prometheus and Grafana)
Prometheus is an open-source time series DB and alerting toolkit designed for reliability and scalability. Grafana is an open source dashboarding that delivers analytics and interactive visualization web application that integrates with Prometheus to visualize data in real-time.
Usage:
- Scrape metrics from your app server endpoints and store them in the Prometheus DB which can be self-hosted or a service provided by your cloud provider.
- Use Grafana to create custom dashboards that visualize the performance and health metrics of your app server.
- Create alerts in Grafana for critical issues like high CPU usage or memory leaks.
3. APM Vendors
Different APM vendors provide capabilities to monitor web and app servers to a varying degree depending on their native capabilities.
Usage:
- Some APM vendors provide agents on your app servers to collect detailed performance data.
- Most of the APM providers also deliver dashboards to monitor key performance indicators (KPIs) like response times, throughput, and error rates.
- More recently some vendors have started experimenting with AI-powered analytics to detect anomalies and predict potential issues.
4. Apache Tomcat Monitoring Tools
Apache Tomcat is a popular open-source Java application server used to run Java-based web applications. Monitoring Tomcat effectively is essential for ensuring application performance and stability.
Usage:
- Tomcat Manager: Use the built-in Tomcat Manager application to monitor server status, view server logs, and manage web applications.
- JMX (Java Management Extensions): Enable JMX in Tomcat to monitor JVM performance metrics such as memory usage, thread counts, and garbage collection stats.
- VisualVM: A visual tool integrating several monitoring and troubleshooting tools for the JVM. It provides detailed insights into Tomcat’s memory usage, thread activity, and CPU performance.
Best Practices for App Server Monitoring
Regular Monitoring and Maintenance
Consistently monitor your app server’s performance and health. Regular maintenance tasks such as updating software, cleaning up logs, and optimizing configurations are essential for maintaining performance and security.
Performance Tuning
Regularly review and optimize your app server configurations. This includes tuning JVM settings, optimizing database connections, and refining thread pool sizes to ensure optimal performance.
Capacity Planning
Plan for future growth by analyzing trends and forecasting resource needs. Effective capacity planning helps prevent resource shortages and ensures your app server can handle increased loads.
In conclusion, effective app server monitoring is essential for maintaining the performance, security, and reliability of your applications. By using the right tools and following best practices, you can ensure that your app servers operate at peak efficiency. Whether you are using Apache Tomcat or other application servers, integrating a comprehensive monitoring solution like meshIQ can significantly enhance your monitoring capabilities, providing real-time insights, automated troubleshooting, and proactive performance optimization.
Ready to optimize your app server monitoring? Schedule a demo or contact us today to see how meshIQ can transform your observability.